What follows is a story about a team of doctors and four statisticians and a puzzle you must solve to break through their noise. There are no trick questions, but you will need to think carefully about the data and the story behind it.
A team of doctors has conducted a 3-month study of a new next-generation cholesterol-reducing drug, Metastatin, with a grand total of 15,673 patients. For the trial, the doctors assigned the patients into three groups: the first received no medication and was not treated otherwise, the second received 100 mg of the drug, and the third received 200 mg.
The patients were told what dose they were receiving, but the doctors ruled out any placebo effect, as other studies had failed to show cholesterol changes for patients in control groups. All patients were monitored for cholesterol levels weekly, and their results were emailed. While no additional doctor consults were necessary, patients could go to the hospital's heart clinic if they wanted to.
Previous studies showed promising results, but this is the first big study on the drug. The doctors believe this drug works by reducing the activity of an enzyme known as HMG-COa reductase, an enzyme that is part of the process that produces cholesterol.
The data was compiled as follows:
Each row corresponds to a patient,, and triage_severity is the identified severity of the initial cholesterol levels in the patient, drug_dose is the dose of the drug, in mg, hmg_coa_reductase is the level of the HMG-COa enzyme (in units per mg) and delta_ldl_cholesterol is the change in LDL cholesterol levels (in mg/dL, the more negative the better).
Lacking expertise in statistics, the doctors have asked three independent statisticians to analyze the resulting data and determine whether the drug works. To their despair, they disagree:
- One believes the drug doesn't work
- One believes the drug actually increased cholesterol
- One believes the drug works and reduces cholesterol as expected.
- One found the same result as the second, finding a clear cholesterol increase.
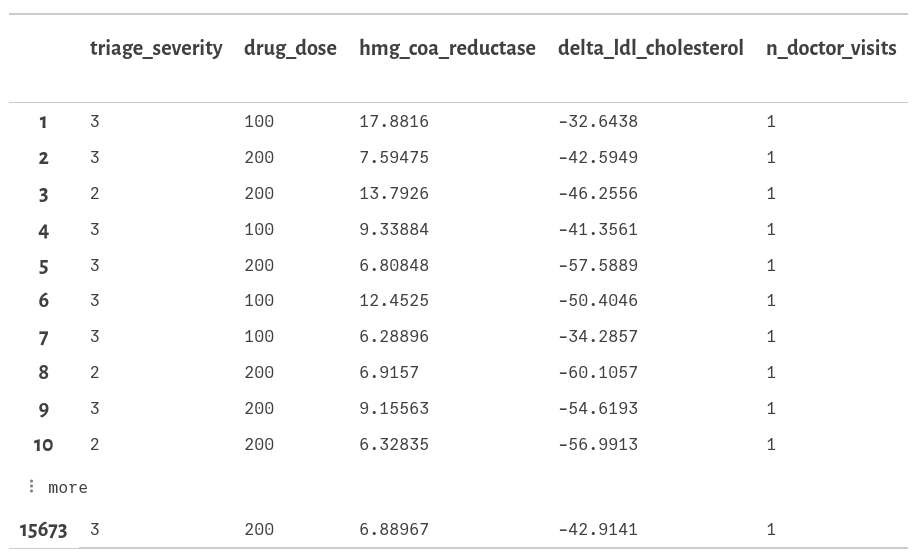
The first statistician: Amanda
Amanda did the obvious thing anyone would do if they were trying to figure out whether a drug works. In his opinion, simplicity is king, and where others would get lost in the details, he just compared the dose given, with the change in cholesterol during the study:
There's barely a change. It's clear that the drug doesn't work, or if it does, the effect is too small to be detected among 15,000 patients.
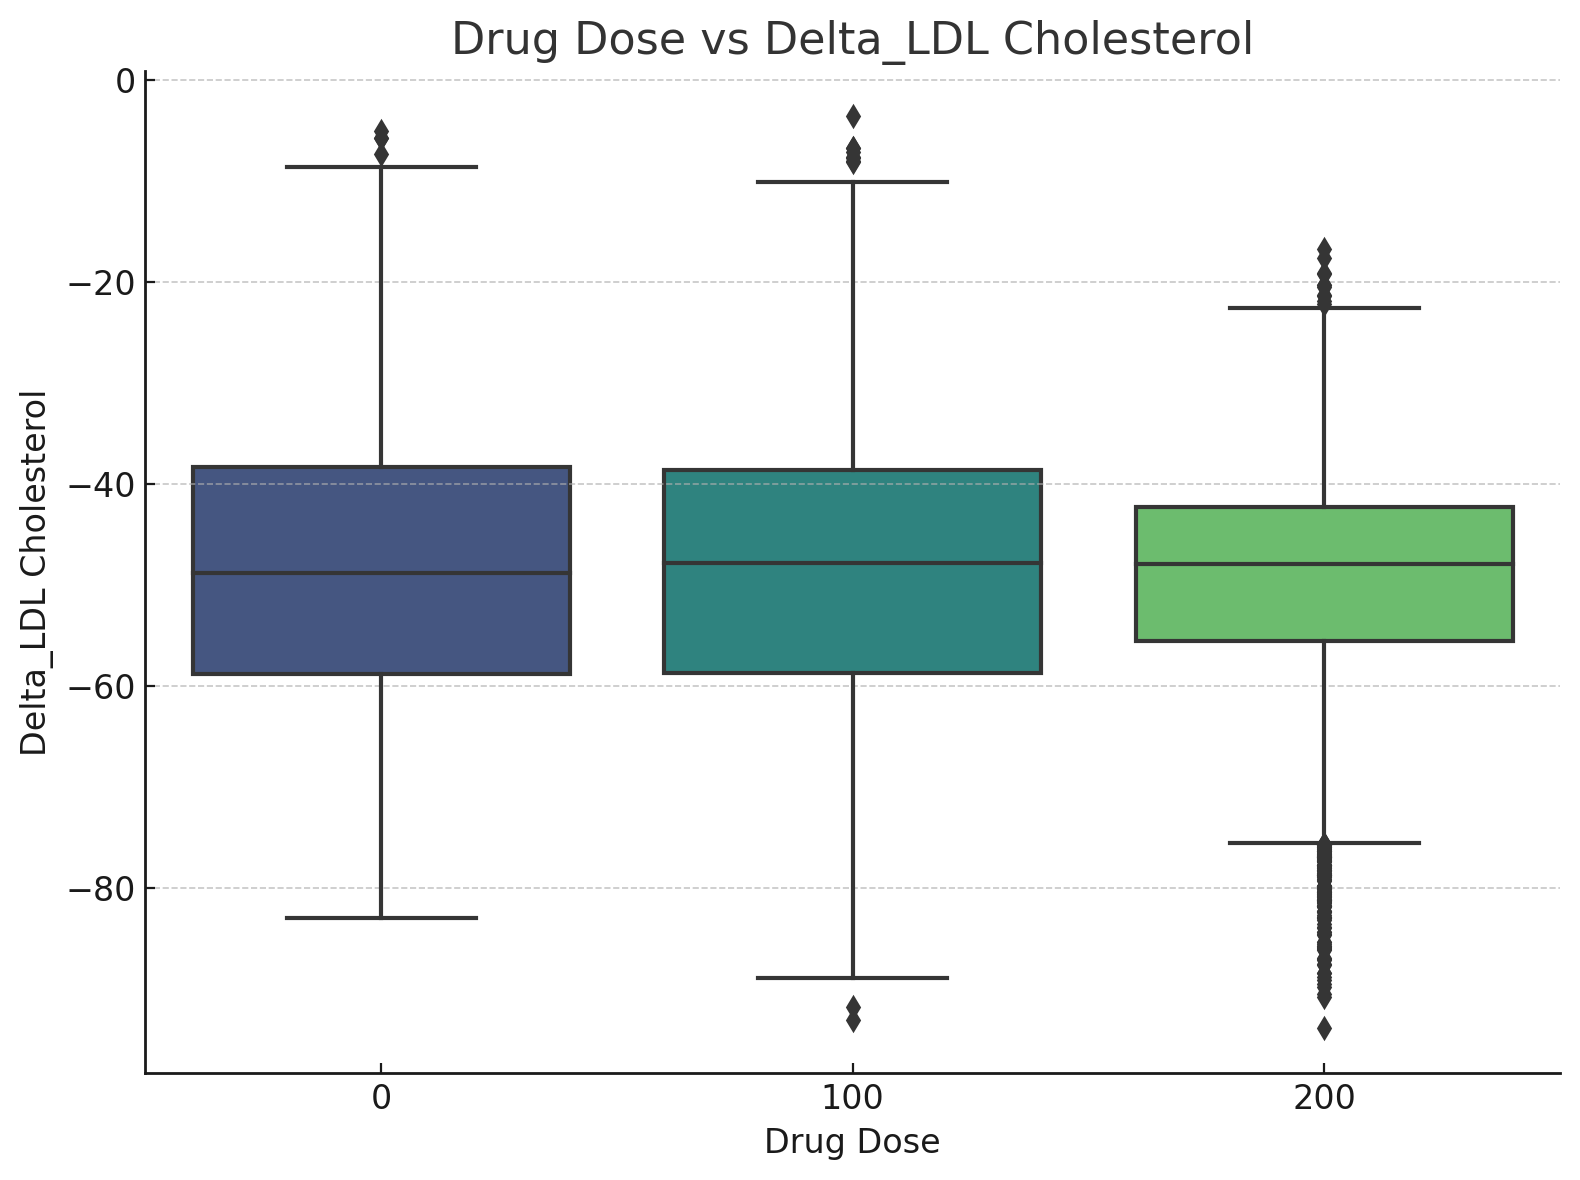
The second statistician: Bob
The second statistician, Bob, paid attention and realized that by far the most crucial variable in the study was the activity of the HMG-COa enzyme. This way, we can not only see the resulting cholesterol level, but we can also take a peek at whether the proposed mechanism of the drug is working. This will increase the precision of the analysis, as it allows us to analyze the entire causal path:

Because there is a significant amount of noise, Bob decides to run a linear regression to try to isolate the effect of the drug, adjusting for the enzyme activity, with the following results:
delta_ldl_cholesterol ~ 1 + drug_dose + hmg_coa_reductase

Coefficients:
────────────────────────────────────────────────────────
                         Coef.    Lower 95%    Upper 95%
────────────────────────────────────────────────────────
(Intercept)        -69.2125     -70.1727     -68.2523
drug_dose            0.0688764    0.0648627    0.0728901
hmg_coa_reductase    0.980843     0.937996     1.02369
The coefficient for the drug dose implies that for every mg of the drug, the cholesterol increases by 0.06 mg/dL!
Bob concludes the report by hypothesizing that the drug is showing paradoxical effects from having doses that are too big, or, perhaps, the mechanism was misidentified.
The third statistician: Alice
Alice also paid a lot of attention to the doctors, and armed with his knowledge about study design, he figured out that adjusting for the severity of the patients when they joined the study was key:
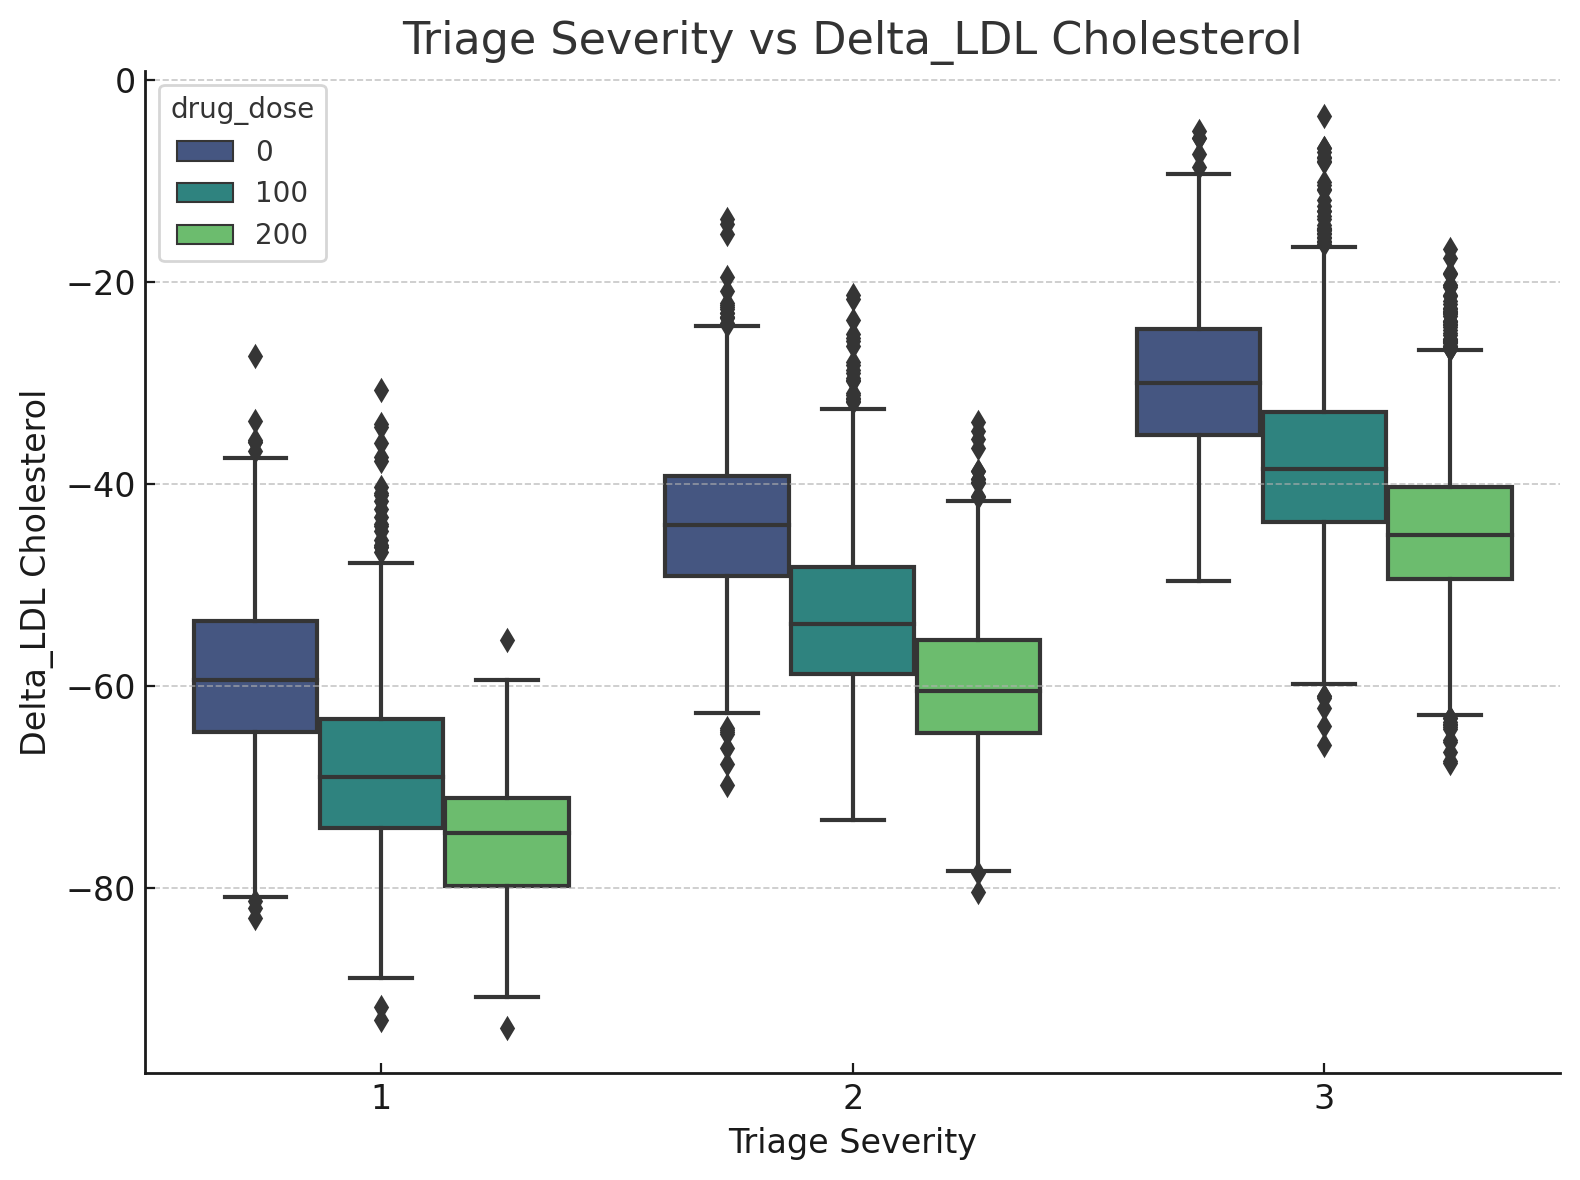
As you can clearly see, once you adjust for severity, a clear trend has appeared in the data: the drug not only works, but it is tremendously effective. Patients who received the full dose of 200 mg saw reductions of almost 20 mg/dL of LDL cholesterol compared to the control group, so the answer is obvious: the drug works.
The fourth statistician: Robin
Robin noticed a variable no one had imagined could be relevant to the study. He remembered that the doctors explained that the patients could visit the clinic, so he realized that this variable could be accounting for some of the effects on the cholesterol levels. Perhaps patients with greater doses feel more worried, so they go to the doctor, and they prescribe other drugs or changes that increase the effect. He adjusted for the variable, resulting in the following graph:

There certainly is an association. It's messy due to the discontinuities in the data, but it seems that even if we limit ourselves to the ranges where we have complete data, the bigger doses result in significantly lesser reductions. Just look at the patients with 3-5 visits!
The drug is disastrous, and further trials should be immediately stopped.
But who is right?
The team of doctors is perplexed by these results. How could three statisticians get three mutually contradictory answers?
They have hired you to figure out the real answer. Does the drug work? Is it harming patients? Is it just useless? They've decided to help you answer these questions, so they've provided you with the results of the previous statisticians, and they've assigned Doctor Mateo to answer any questions you might have about the study in question. You should find the origin of the contradictions and determine which statistician is right based on the information given.
Once you're somewhat sure of your answer, select your choice below: